


Sets is a topic with very simple fundamentals but could give us some difficult-looking GMAT statistics questions. Let’s take a look at one such GMAT min max problem today.
Question: A group of people were given 2 puzzles. 79% people solved puzzle X and 89% people solved puzzle Y. What is the maximum and minimum percentage of people who could have solved both the puzzles?
(A) 11%, 0%
(B) 49%, 33%
(C) 68%, 57%
(D) 79%, 68%
(E) 89%, 79%
Solution: The first thing to note here is that we do not know the % of people who could not solve either puzzle. All we know is that puzzle X was solved by 79% of the people and puzzle Y was solved by 89% of the people.
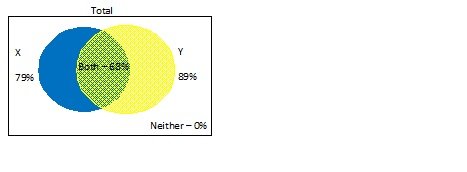
Let’s first try to maximize the % of people who solved both the puzzles. We want to make these two sets overlap as much as possible i.e. we need to get them as close to each other as possible. Region of overlap can be 79% at most since we know that only 79% people solved puzzle X. In this case, the venn diagram will look something like this.
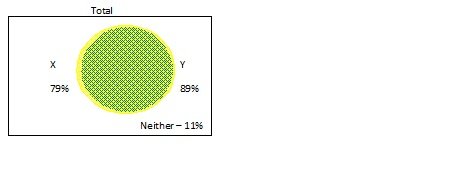
Hence, the maximum % of people who could have solved both the puzzles is 79%.
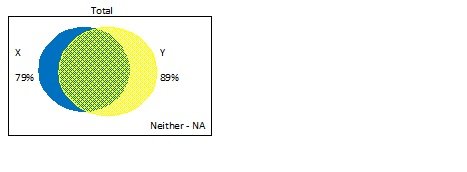
Now, let’s try to minimize the % of people who solved both the puzzles. We want the sets to be as far apart as possible. In this case, the % of people who solved neither puzzle must be 0. Only then will the overlap of the sets be as little as possible.
In this case, 68% people must have solved both the puzzles.
Hence, the answer is (D).
If the question instead gave you the % of people who did not solve either puzzle (e.g. by giving you that everyone solved at least one puzzle), then there is no question of maximizing/minimizing the % of people who solved both the puzzles. Consider this:
(For ease, let’s drop the percentage and work with just numbers.)
Total no. of people = No. of people who solved X + No. of people who solved Y – No. of people who solved both + No. of people who solved neither
100 = 79 + 89 – No. of people who solved both + No. of people who solved neither
No. of people who solved both – No. of people who solved neither = 68
We can maximize/minimize the two numbers by adjusting them against each other. If one increases, the other increases too. If one decreases, the other decreases too.
If no. of people who solve both = 68, no. of people who solve neither = 0
If no. of people who solve both = 69, no. of people who solve neither = 1
If no. of people who solve both = 79, no. of people who solve neither = 11
If you are given the number of people who solved neither, you have a fixed number of people who solved both. Hence, maximizing or minimizing becomes pointless.
You can also work on this concept logically –
Say, every solution of every puzzle was written down on a separate sheet of paper. Then there would be 168 sheets of paper in all (79 + 89). If everyone solved 1 puzzle, then we have accounted for 100 sheets. The other 68 sheets were made by 68 people who have already solved one puzzle each. Hence, 68 people would have solved both the puzzles. If instead, 99 people solve at least one puzzle and one person solves no puzzle, then 69 (obtained by 168 – 99) sheets would have been made by people who have already solved one. Hence 69 people would have solved both the puzzles. Note here that the number of people who solved neither and the number of people who solved both are not independent of each other. One number depends on the other. It will be good if you make a note of this in your log book.